X16Emu ADD — the Advanced Disassembler and Debugger for the Commander X16






X16Emu ADD — the Advanced Disassembler and Debugger — is a fork of the
official Commander X16 emulator built for people who write software for the X16
rather than just run it. It is the upstream emulator with a real debugger bolted on: a dockable
graphical debug UI, source-level debugging from cc65 .dbg files, and a Debug Adapter Protocol
server so the machine can be driven from VS Code, Visual Studio, or any other DAP-speaking editor.
Everything the official emulator does, ADD does too.
⚠️ This is experimental software
The emulator core is upstream and is great, but the debugger, the DAP server and the Windows-specific changes are experimental and probably not great. Expect rough edges, and expect details to change between releases.
That said it has been used successfully to carry several real Commodore 64 to X16 porting projects through to completion, which is exactly the work it was built for. Anyone debugging assembly on the X16 today will very likely save time with it. This software is purpose built to further personal projects and make my life easier. If it makes your life easier, great!
It is published as-is, and is not formally supported at this time.
Why X16Emu ADD
| Graphical debugger | A dockable Dear ImGui debug window with disassembly, CPU, memory, source, call stack, symbols, breakpoints, I/O and file access, VERA/PSG/FM/PCM inspectors, and a performance budget view. |
| Source-level debugging | Point it at a cc65 .dbg file and step through the original .s/.c source, with labels, equates and live values. .dbg files auto-load, including for overlays the program LOADs at runtime. |
| Debug from an editor | A built-in DAP server means breakpoints, stepping, watches, memory and disassembly in VS Code, Visual Studio, or any DAP-speaking client. |
| Conditional breakpoints | Break on A == $05, byte[$1234] != 0, a specific RAM bank, or the Nth hit. |
| Watchpoints | Break on writes to an address or a whole range, with up to 64 of them. |
| Scriptable input | Inject keystrokes, typed text and joystick state over DAP, making automated regression runs of a game practical. |
| VERA inspectors | Live palette, tile, sprite, bitmap and tilemap viewers plus fully decoded VERA registers — decoded per scanline, so raster splits are visible. |
| 65C816 / GS aware | 24-bit bank:address memory browsing, mode-correct register widths, and the X16 virtual registers R0–R15 broken out. |
| Real Windows builds | Self-contained statically linked x16emu.exe for x64, x86 and ARM64. No SDL2, zlib or Visual C++ redistributable to install. |
| The window doesn't freeze | On Windows the emulator keeps running and painting while its window is dragged or resized. |
| Automated releases | Every push is built for all platforms; tagging stages a draft release with all the assets attached, ready for a human to publish. |

Stopped mid-loop in a cc65 assembly program: your own source on the left with the current line
highlighted, 65C816-aware registers and the X16 virtual registers R0–R15 on the right, and a
live hex editor underneath. Every panel is dockable, and the machine keeps running in its own
window while you inspect it.
The debugger is documented in full, panel by panel and with a screenshot of each, under Advanced Debugging below.
Relationship to the official emulator
ADD exists to add debugging tooling, not to diverge from the X16 platform. It has no relation to upstream development. Don't bug the upstream developers about it.
Everything about the Commander X16 itself — the KERNAL, BASIC, VERA, the hardware, the file formats — is documented officially, and those docs apply here unchanged:
- Official X16 documentation — the reference for the machine, its KERNAL and BASIC
- x16-rom — the KERNAL/BASIC ROM sources
- Official emulator — upstream, whose release notes cover the emulator core each ADD build is based on
- commanderx16.com
Use the official docs for the machine. Use this README for what ADD adds on top.
Version and release numbering
Releases are named R49.nnn:
R49names the official Commander X16 release line the build follows. It is not a promise of byte-for-byte equivalence with official R49: the emulator core tracks upstream's ongoing development after that release, so a build may include upstream fixes made since R49 was cut.nnncounts the ADD builds on top of it, and goes up as ADD's own features land.
When upstream cuts its next release, ADD releases move to R50.001 and so on. A release is cut by
pushing an R49.nnn tag, which is what the build workflow keys on; if you also want a branch
for a release line, give it a distinct name such as release/R49.001, since a branch and a tag
sharing one name makes R49.001 ambiguous to git.
Each release package ships the rom.bin it was built and tested against — use that one. Older ROMs
may not work with newer emulators, and vice versa.
Features
Inherited from the official emulator:
- CPU: 65C02 and 65C816 instruction sets, selected by command line switch
- VERA
- Mostly cycle exact emulation
- Supports almost all features:
- composer
- two layers
- sprites
- VSYNC, raster, sprite IRQ
- Sound
- PCM
- PSG
- YM2151
- MIDI via FluidSynth
- Real-Time-Clock
- NVRAM
- System Management Controller
- SD card: reading and writing (image file)
- VIA
- ROM/RAM banking
- keyboard
- mouse
- gamepads
Added by ADD:
- Dear ImGui graphical debugger (
-imgui) - Debug Adapter Protocol server for editor-based debugging (
-debugport) - cc65 source-level debugging (
-dbgfile,-srcpath) - Conditional breakpoints, hit counts and memory watchpoints
- Statically linked MSVC builds for Windows x64/x86/ARM64
- Non-blocking window drag and resize on Windows
Binaries & Compiling
Binary releases for macOS, Windows and Linux are available on the X16Emu ADD releases page. The official builds, which have upstream's keyboard-driven debugger but none of ADD's tooling, are over here.
Which Windows download?
Windows ships in three flavours. Unless you have a reason to pick otherwise, take x16emu_win64.
| Package | What it is |
|---|---|
x16emu_win64, x16emu_win32, x16emu_win-arm64 | A single self-contained x16emu.exe, statically linked. Nothing to install — no SDL2, zlib or Visual C++ redistributable. Built without FluidSynth, so it offers no MIDI options at all. |
…-midi | A separate build with FluidSynth compiled in, shipped with libfluidsynth-3.dll for the MIDI synth (-midicard / -sf2). Take this if you want MIDI. |
x16emu_win64-mingw, x16emu_win32-mingw | The older MinGW build, kept as a fallback. Ships MIDI support and the -trace option, at the cost of around 25 DLLs alongside the executable. |
All of them include the debugger and the DAP server.
Development builds
Every check-in to main refreshes the dev prerelease, so there is always a
current build to download without waiting for a tagged release. It is not an official release and
carries no promises, but it is built and unit-tested by the same workflow that cuts the real ones.
The tag and the file names never change, so a link keeps working as the build rolls forward:
https://github.com/xylothan/x16-emulator/releases/download/dev/x16emu_win64-dev.zip
https://github.com/xylothan/x16-emulator/releases/download/dev/x16emu_linux-x86_64-dev.zip
https://github.com/xylothan/x16-emulator/releases/download/dev/x16emu_macos_m1-dev.zip
Swap in any package name from the table above. Which build you actually have is recorded three
ways: in the release title, in BUILD_VERSION.txt inside the zip, and on the last page of the
bundled README.pdf. They all read the same identifier, for example:
r49-dev-20260810.003
That is the upstream release this fork sits on, the UTC date, and how many commits landed that
day — so .003 is the third check-in of the tenth.
Two differences worth knowing about the default builds:
- The non-
-midipackages are built without FluidSynth, so they do not offer the MIDI options at all — they will not appear in-h, and dropping the DLL next to one will not enable them. - The MSVC builds have no
-traceoption. The generated ROM listing contains a string literal larger than MSVC's 16 KB limit, so a trace-enabled build cannot compile. Use the-mingwpackage if you need-trace.
The emulator itself is dependent only on SDL2. However, to run the emulated system you will also need a compatible rom.bin ROM image. This will be
loaded from the directory containing the emulator binary, or you can use the -rom .../path/to/rom.bin option.
WARNING: Older versions of the ROM might not work in newer versions of the emulator, and vice versa.
You can build a ROM image yourself using the build instructions in the x16-rom repo. The rom.bin included in the latest release of the emulator may also work with the HEAD of this repo, but this is not guaranteed.
Building from source
The emulator depends on SDL2. The debugger and DAP server add two more requirements:
- a C++17 compiler, because Dear ImGui and the debug UI are written in C++ (Dear ImGui itself is
vendored in
src/extern/imgui/, so there is nothing to install for it), and - cJSON, used by the DAP server —
libcjson-devon Debian/Ubuntu,cjsonon Homebrew, or supplied by vcpkg on Windows.
Both the ImGui debugger and the DAP server are always compiled in; -imgui and -debugport
are runtime switches, so there is nothing to enable at build time.
macOS Build
Install SDL2 using brew install sdl2, and cJSON using brew install cjson.
Linux Build
The SDL2 development package is available from the package repositories of most major Linux distributions:
- Red Hat:
yum install SDL2-devel cjson-devel - Debian:
apt-get install libsdl2-dev libcjson-dev
Type make to build the source. The output will be x16emu in the current directory. Remember you will also need a rom.bin as described above.
WebAssembly Build
Steps for compiling WebAssembly/HTML5 can be found here.
Windows Build
build.ps1 at the repo root wraps all of this. It finds the installed Visual Studio, picks the
CMake that can actually drive that generator, locates vcpkg, and selects the matching preset from
CMakePresets.json:
.\build.ps1                      # Debug build of the emulator
.\build.ps1 -Config Release      # Release build
.\build.ps1 -Tests               # build and run the unit test suite
.\build.ps1 -Run                 # build, then launch it
.\build.ps1 -DapTest -FetchRom   # download a ROM, boot, run the DAP testbench
.\build.ps1 -Dbg                 # build tools/x16dbg, the .NET DAP client
Useful extras: -Target <name> for a single CMake target, -Rom <path> to point at a ROM (or set
X16_ROM), -Clean / -Reconfigure, -Force to stop an emulator that is holding x16emu.exe
open, and -EmuArgs '-prg','A.PRG','-run' to pass arguments through to the emulator.
Get-Help .\build.ps1 -Full lists them all.
Two things it exists to save you from: the CMake on PATH is often older than the installed
Visual Studio and does not know its generator, which fails with a wall of generator names that
never mentions the real problem; and a running emulator holds its own .exe open, so the link step
dies with a bare LNK1104 that says nothing about why.
Building by hand
The Windows releases are built with MSVC and CMake, using vcpkg for dependencies and custom
triplets in vcpkg-triplets/ that link everything statically. That is what produces the
self-contained x16emu.exe in the release packages:
cmake -B build -G "Visual Studio 17 2022" -A x64 ^
  -DCMAKE_TOOLCHAIN_FILE=%VCPKG_INSTALLATION_ROOT%/scripts/buildsystems/vcpkg.cmake ^
  -DVCPKG_OVERLAY_TRIPLETS=vcpkg-triplets ^
  -DVCPKG_TARGET_TRIPLET=x64-windows-x16emu ^
  -DCMAKE_MSVC_RUNTIME_LIBRARY=MultiThreaded ^
  -DENABLE_TRACE=OFF
cmake --build build --config Release
Use -A Win32 with x86-windows-x16emu, or -A ARM64 with arm64-windows-x16emu, for the other
architectures. Add -DENABLE_FLUIDSYNTH=ON -DVCPKG_MANIFEST_FEATURES=midi for a MIDI build.
ENABLE_TRACE must stay off under MSVC: the generated ROM listing contains a string literal
larger than MSVC's 16 KB limit.
The output is build\Release\x16emu.exe and build\Release\makecart.exe. Remember you will also
need a rom.bin as described above.
Cross-compiling from macOS/Linux/MSYS2 with mingw-w64 also still works. Install the mingw-w64 toolchain and the mingw32 version of SDL, then:
CROSS_COMPILE_WINDOWS=1 MINGW32=/usr/x86_64-w64-mingw32 WIN_SDL2=/usr/x86_64-w64-mingw32 make
Paths to those libraries can be changed to your installation directory if they aren't located there.
The output will be x16emu.exe in the current directory. You will also need SDL2.dll from SDL2's binary folder.
Starting
You can start x16emu/x16emu.exe either by double-clicking it, or from the command line. The
latter allows you to specify additional arguments. When starting x16emu without arguments, it
will pick up the system ROM (rom.bin) from the executable's directory.
The command line options of the official emulator work here too — -prg, -bas, -run, -scale,
-sdcard, -fsroot, -warp, -gif, -wav, -ram, -c816 and the rest. They are documented in
the official emulator's README. Two caveats, both from the packaging rather than
from ADD itself: the MSVC builds have no -trace, and the non--midi packages have no MIDI
options at all. x16emu -h is the authoritative list for the build you actually have.
The options below are the ones ADD adds on top. They all concern debugging.
| Option | What it does |
|---|---|
-imgui | Opens the graphical debugger in its own window, with dockable panels for the CPU, memory, disassembly, source, breakpoints, symbols, the call stack, VERA graphics, the three audio sources, I/O ports and file access, and the performance budget. Additive: independent of, and combinable with, -debug. |
-debugport [<port>] | Starts the Debug Adapter Protocol server so an IDE can attach. Default port 9009. |
-bp <address> | Arms a breakpoint before the first instruction runs, for catching start-up code you could never attach to in time. Can be repeated. Needs a debugger to resume from, so it opens -debug unless -imgui or -debugport is already giving you one. See Catching early boot with -bp. |
-dbgfile <path> | Loads a cc65 .dbg file, so addresses map back to source files and line numbers. |
-dbgauto / -no-dbgauto | Whether to merge the .dbg beside each program the machine loads. Follows the debugger unless forced either way. |
-srcpath <dir> | Adds a directory to search for the source files a .dbg names. Can be repeated. |
Upstream's -debug [<address>] still works. ADD does not extend it; see the
official README for what it does.
All of these are covered properly under Advanced Debugging.
Using the emulated machine
Running the X16 itself — the keyboard layouts, BASIC and the screen editor, SD card images, the
host filesystem interface, GIF and WAV recording, the emulator I/O registers at $9FB0-$9FBF,
the CRT cartridge format, the makecart tool, and the WebEmulator's URL options — is identical
to the official emulator and is documented there, with one addition: ADD uses the otherwise unused
register $9FBC for performance budget markers, which a program can
write to say exactly where its frame work begins and ends. It reads back a protocol version, so
guest code can detect whether the emulator it is running under understands them.
- Official emulator README — command line options, recording, I/O registers,
SD card images, HostFS, the CRT format and
makecart - Official X16 documentation — the machine itself, its KERNAL and BASIC
- WebAssembly notes — building the web target
The emulator hotkeys (Ctrl+F for fullscreen, Ctrl+M for mouse capture, Ctrl+R to
reset, Ctrl+V to paste, and so on, or their command-key equivalents on macOS) are upstream's
and are unchanged. ADD adds a few of its own, listed under
Keyboard shortcuts.
Advanced Debugging
This is the part of the emulator ADD exists for. There are two ways to debug, and they are additive — either or both can be turned on:
| You want | Use | Start with |
|---|---|---|
| A graphical debugger with panels, source view and VERA inspectors | ImGui debugger | -imgui |
| To debug from VS Code / Visual Studio / a script | DAP server | -debugport |
Upstream's own small keyboard-driven debugger (-debug) is still present and still works, but
ADD does not extend it and it is documented upstream. Everything below
describes the ImGui debugger and the DAP server.
A good default for day-to-day assembly work:
x16emu -imgui -prg myprog.prg -run
A good default when your source is built with cc65:
x16emu -imgui -prg myprog.prg -run -dbgfile myprog.dbg -srcpath ./src
⚠️ The ImGui debugger and the DAP server are experimental and probably broken. They have helped complete several real C64→X16 porting projects, but treat the debugger like a goat that eats your homework: if something looks funny, assume it is doing something wrong until you can prove otherwise. Expect rough edges and occasional changes to keys, layouts and DAP details between releases.
Using the debugger and an editor at the same time
Breakpoints live in one place. Whether a breakpoint came from -bp on the command line, F9 in
the debugger, the ImGui breakpoints panel, or your editor over DAP, there is a single table
deciding where the machine stops, and each of those can hold a breakpoint at the same address
without disturbing the others. Disconnecting your editor takes away the breakpoints it asked
for and leaves yours alone.
The emulator's own UIs share one view of that table: a breakpoint you set with F9 appears in the ImGui panel, and one you disable there still shows in the Disassembly and Source gutters.
An editor attached over DAP is the exception, because it keeps its own list:
- A breakpoint you set with F9 will not appear in your editor's gutter.
- A breakpoint you delete with F9 goes away in the emulator, but your editor still believes in it — and because DAP clients re-send a source file's whole breakpoint list whenever you edit it, your editor will usually put it back.
This is a limitation of the protocol rather than an oversight: in DAP the client owns its breakpoint list and is expected to be authoritative about it. If you are driving the emulator from an editor, the least surprising approach is to manage breakpoints from the editor and treat F9 as a local, temporary override.
The ImGui debugger
-imgui opens a second, resizable OS window titled "Commander X16 - ImGui Debugger",
960×720, placed next to the emulator window. It is available in the native Windows, Linux and
macOS builds.
It does not require -debug, and it does not replace the emulator window — the machine keeps
running in its own window while you inspect it.
Panels
Every panel is dockable, closable and reopenable from the View menu. Each one is shown in A tour of the panels below.
| Panel | What it gives you |
|---|---|
| Disassembly | Live disassembly around the PC. Hovering an operand shows the effective address and the value there. Right-click for Run to here and Toggle breakpoint. |
| CPU | Registers with 65C816-aware widths, decoded status flags, and the stack with the most recent push on top. A collapsible Virtual Regs (R0–R15) section shows the X16 pseudo-registers at $02–$21. A collapsible Watch section holds your own address watches — bank-qualified, up to 16 bytes each, editable, with hex/decimal/binary tooltips. |
| Memory | A hex editor with three tabs: CPU (the CPU map), Banked (browse any RAM bank at $A000–$BFFF) and VRAM (VERA's full 17-bit address space). Drag to select a range, search by hex bytes or ASCII with Find Next/Prev, jump to an address, and watch changed bytes flash. Right-click to Add to watch, Add range to watch, Copy address, Break on write or Clear selection. Edits go through the normal write path, so I/O side effects happen and watchpoints fire. |
| Source | Your original .s/.c source in tabs, with the current line highlighted and centred on each stop. For C, stepping moves a whole statement at a time rather than an instruction. Right-click for Run to here and Toggle breakpoint. Open… pre-loads a file so you can set breakpoints before the PC ever gets there. Hovering a label or number resolves it to an address and its live value. |
| VERA | Six tabs: Registers (all 32 registers $9F20–$9F3F, fields decoded), Palette, Tiles, Sprites, Bitmap and Tilemap. Each view decodes using the registers that actually rendered each scanline, so raster splits show up correctly rather than being flattened to the end-of-frame state. |
| Breakpoints | Every breakpoint, with its condition and hit count. Enable, disable or delete individually. |
| Symbols | A filterable list of every label from your .dbg, with live values. Right-click to Go to, Toggle breakpoint or Run to here. |
| Call Stack | A heuristic 65xx stack unwind. Frames are named after the nearest enclosing label, so even code without debug info gets a useful name. Click a frame to jump there in both source and disassembly. |
| PSG | VERA PSG voices with live register values, plus scope traces. |
| YM2151 | FM channel state and scope traces. |
| PCM | VERA PCM state and scope traces. |
| I/O | What the machine is doing to its ports. An Activity log of register accesses and decoded device events, each row naming and explaining the register it touched; SD Card command, block and status state; Files — every file the machine has opened, by name, on either file path; Joysticks with buttons decoded and lit live; VIA, I2C (with the SMC and RTC behind it) and Serial, each annotated with what the bits are wired to. |
| Performance | How much of a frame your code actually uses. Work / interrupt / waiting split against a 60, 30 or arbitrary fps budget, a per-frame history graph with the budget drawn across it, rolling min/mean/p50/p95/p99/max with budget overruns, and a per-routine breakdown by address zone or guest marker. |
While the machine is paused, the audio panels keep drawing their scope traces by projecting from the current register state, so you can see what a voice would be doing at the moment you stopped.
Toolbar

Along the top, after the menus: Continue, Pause, Step Into, Step Over, Step Out (each greyed out when it does not apply and each showing its shortcut in the tooltip), then the speed control, then a status readout.
The speed control shows the emulated clock as a real number — 1.75MHz, 800kHz, or warp —
rather than a percentage, coloured blue below native speed, red above it, and orange in warp
mode. - and + step the speed, 1x returns to the machine's own clock, and Warp removes the
limit entirely.
The status readout shows RUNNING/PAUSED, an IRQ marker (with nesting depth) while the PC is
inside an interrupt handler, the 24-bit PC as KK:PPPP, and the elapsed cycle and instruction counts.
Menus
- View — show or hide any panel.
- Layout — Reset to Default Layout reopens everything and rebuilds the default docking arrangement.
- System — Reset (
Ctrl+Shift+F5, keeps your breakpoints), Trigger IRQ, Trigger NMI, and Settings…. - Help — the keyboard shortcut table, so you never need this README for it.
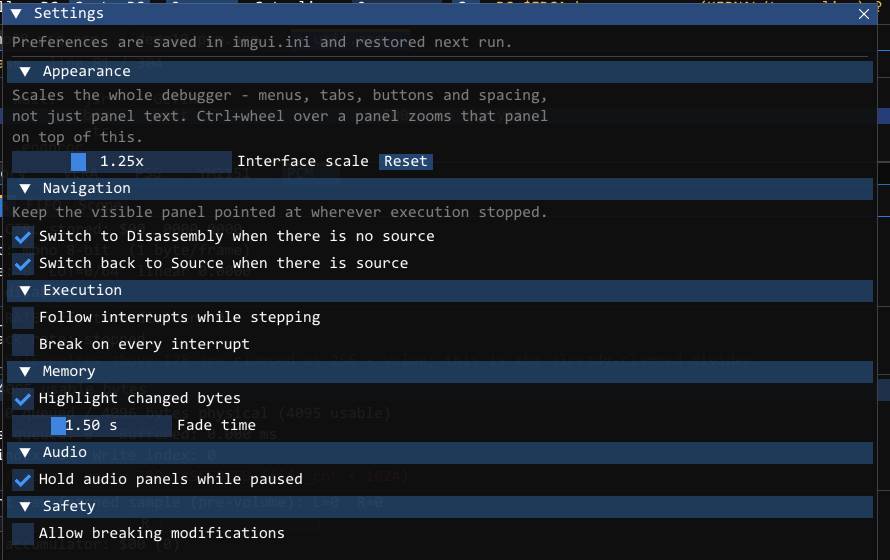
Settings… covers interrupt following, break-on-interrupt, whether a break auto-switches you to
the Disassembly or Source panel, memory change highlighting and its duration, holding audio while
paused, I/O capture and its per-device gating, and the global interface scale. Settings and your
window layout are saved to imgui.ini and restored next run.
Keyboard shortcuts
Active when the debugger window has focus and you are not typing into a search or goto box.
| Key | Action |
|---|---|
F5 | Continue (while paused) |
Break / Pause | Pause (while running) |
F11 | Step into |
Shift+F11 | Step out |
F10 | Step over |
Ctrl+F10 | Run to cursor |
F9 | Toggle a breakpoint at the PC |
Ctrl+Shift+F5 | Reset the machine, keeping breakpoints |
Ctrl+Mouse wheel | Zoom the font of the panel under the cursor |
On macOS these are the physical Control and Shift keys, not Command.
These work in the emulator window and are handy while debugging graphics:
| Key | Action |
|---|---|
Ctrl+F3 | Toggle VERA layer 0 |
Alt+F3 | Toggle VERA layer 1 |
Shift+F3 | Toggle sprites |
Shift+F8 | Toggle KERNAL skip |
A tour of the panels
Every screenshot below comes from one session: a cc65 assembly program built with ca65 -g, run as
x16emu -imgui -prg demo.prg -run -dbgfile demo.dbg -srcpath src
Source-level stepping
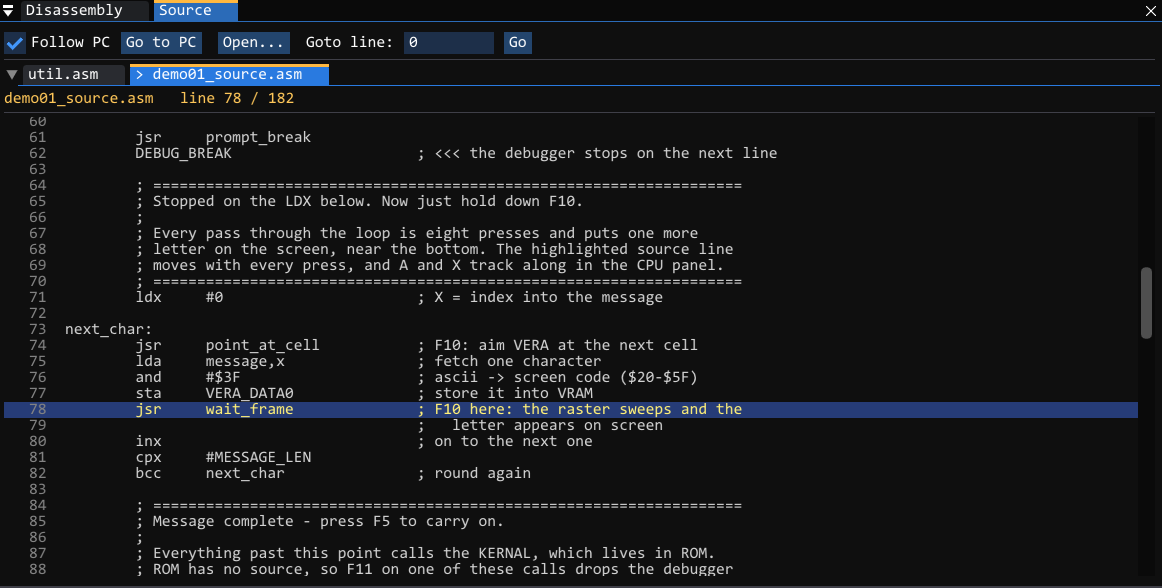
The Source panel shows the file the PC is actually in — comments, labels, original formatting and
all — with the current line highlighted and centred on every stop. Files open as tabs and the panel
switches between them on its own as execution crosses module boundaries, so a program split across
a dozen .s files needs no bookkeeping from you.
F10 walks the highlight down the loop an instruction at a time while A and X track along in
the CPU panel. Open… pre-loads a file the PC has not reached yet, so you can arm a breakpoint
before it ever gets there, and hovering a label or a literal resolves it to an address and its
live value.
Disassembly
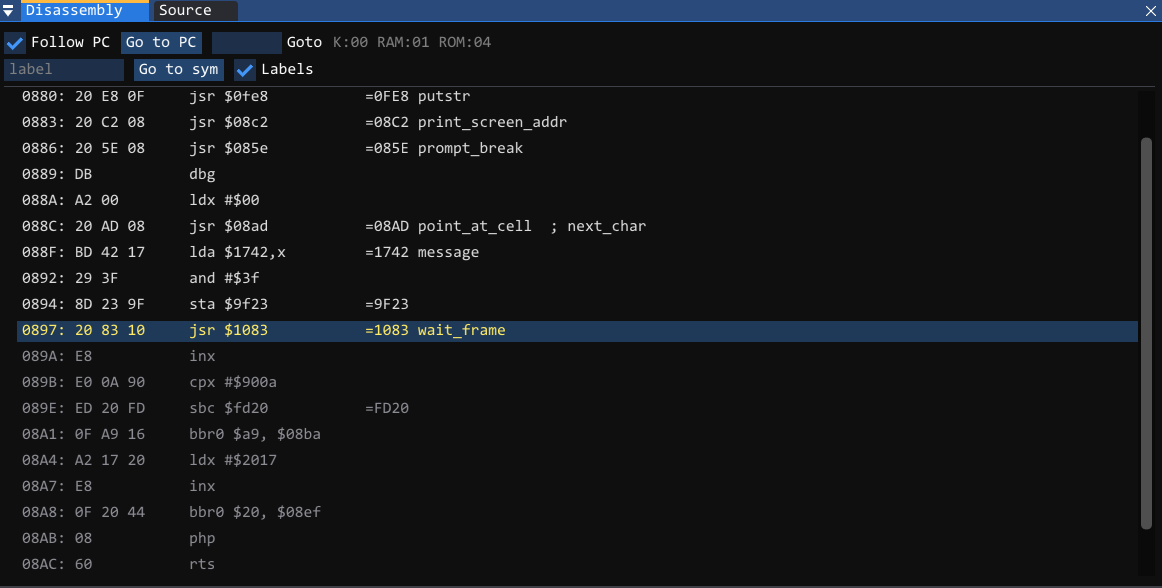
When the PC lands somewhere the debug info does not cover — KERNAL ROM, a trampoline, someone
else's binary — the Disassembly panel takes over. Every operand is resolved to its effective
address and annotated with the symbol living there (=08AD point_at_cell), so ROM code reads
almost as well as your own. Right-click any line for Run to here or Toggle breakpoint.
Which panel comes to the front on a break is a preference, not a rule: Settings… can switch to Disassembly whenever there is no source and switch back when there is.
Call stack
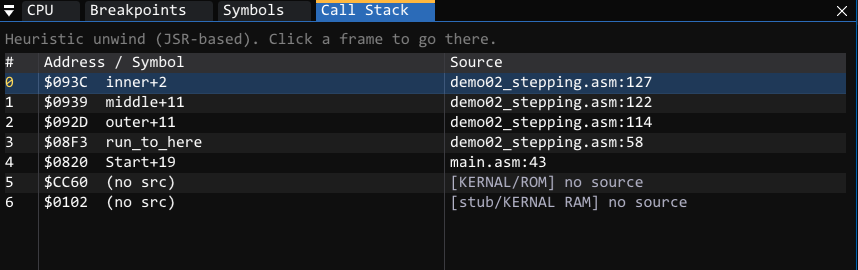
The 65C02 has no frame pointer, so this is a heuristic unwind of the hardware stack — but it is a
useful one. Each frame is named after the nearest enclosing label and resolved back to a source
file and line, and frames that fall outside your debug info are still labelled with where they are
([KERNAL/ROM], [stub/KERNAL RAM]) rather than dropped. Click any frame to send both the Source
and Disassembly panels to it.
Symbols
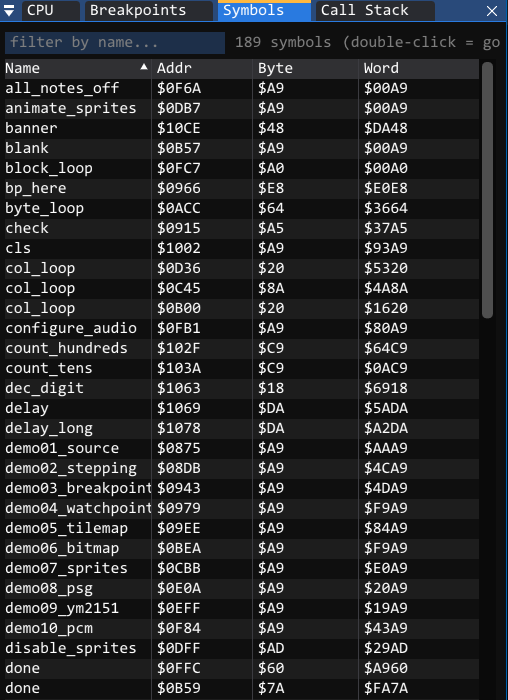
Every label from the .dbg, filterable by name, each with its address and the byte and word
currently living there. Double-click to go to a symbol; right-click for Toggle breakpoint or
Run to here.
CPU, virtual registers and the stack
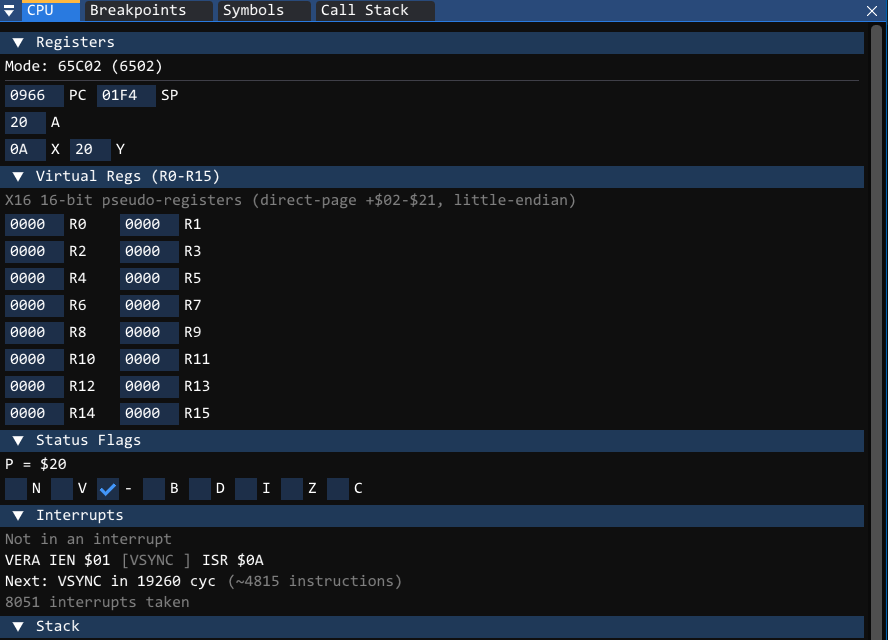
Registers are shown at the width the CPU is actually using — the panel is 65C816-aware, so A,
X and Y widen and narrow with the M and X flags instead of always reading as eight bits.
Status flags are broken out as individual checkboxes, and every field is editable in place.
Two things here are specific to the X16. Virtual Regs (R0–R15) decodes the sixteen 16-bit
pseudo-registers the KERNAL and cc65 keep at $02–$21, so you read R3 rather than working out
which zero-page pair that was. The Interrupts block reports whether you are currently inside a
handler and how deep, the VERA IEN/ISR state, and how many cycles remain until the next VSYNC.
Below that sit the stack, most recent push first, and a Watch section for your own bank-qualified address watches — up to 16 bytes each, editable, with hex/decimal/binary tooltips.
Memory
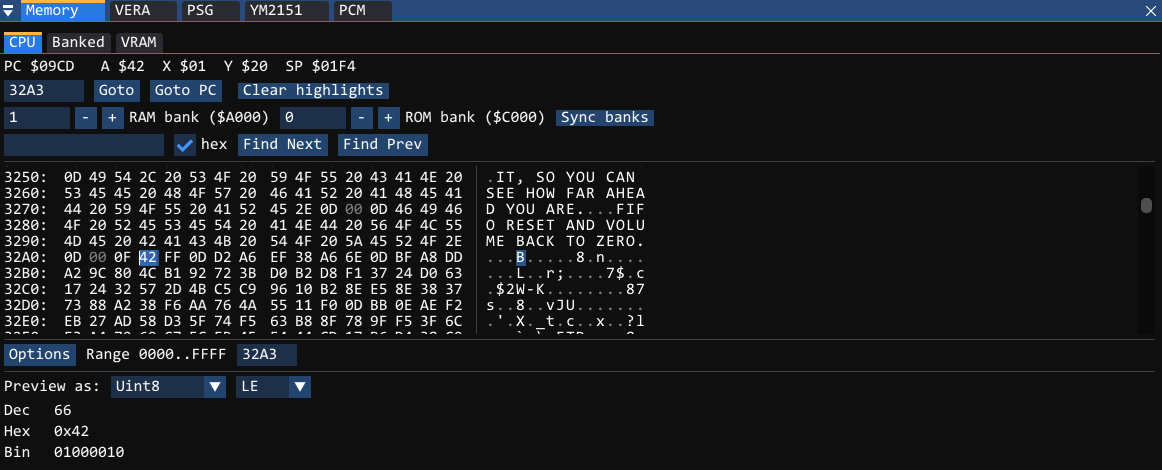
Three tabs: CPU for the processor's view, Banked for any RAM bank at $A000–$BFFF, and
VRAM for VERA's full 17-bit space. Jump to an address, search by hex bytes or ASCII, drag to
select a range, and watch bytes flash as they change. The selection is decoded underneath as
decimal, hex and binary in the type of your choosing.
Edits go through the emulator's normal write path rather than poking the array behind its back, so I/O side effects happen and watchpoints fire exactly as they would have if the program had done it.
Breakpoints
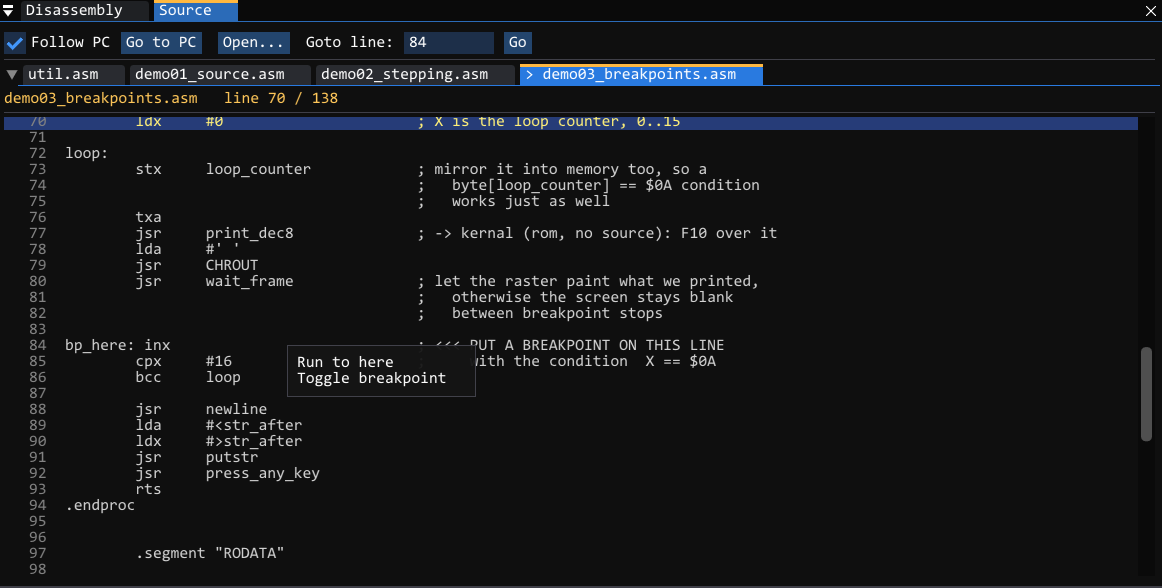
Set one by clicking the gutter in the Source or Disassembly panel, pressing F9 at the PC, or
right-clicking the line:
Conditions and hit counts
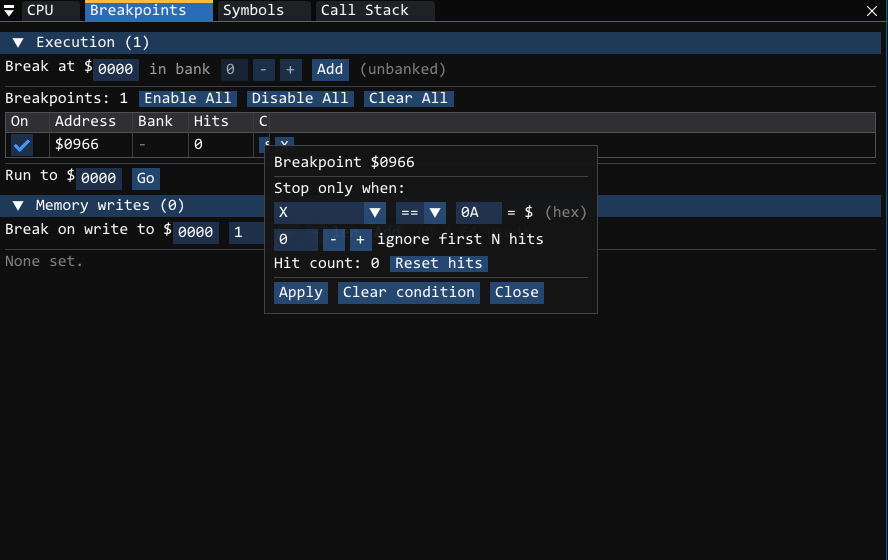
A breakpoint that fires on all sixteen passes of a loop is rarely what you want. Every breakpoint carries an optional condition and ignore count, editable from the Breakpoints panel — no DAP client required:
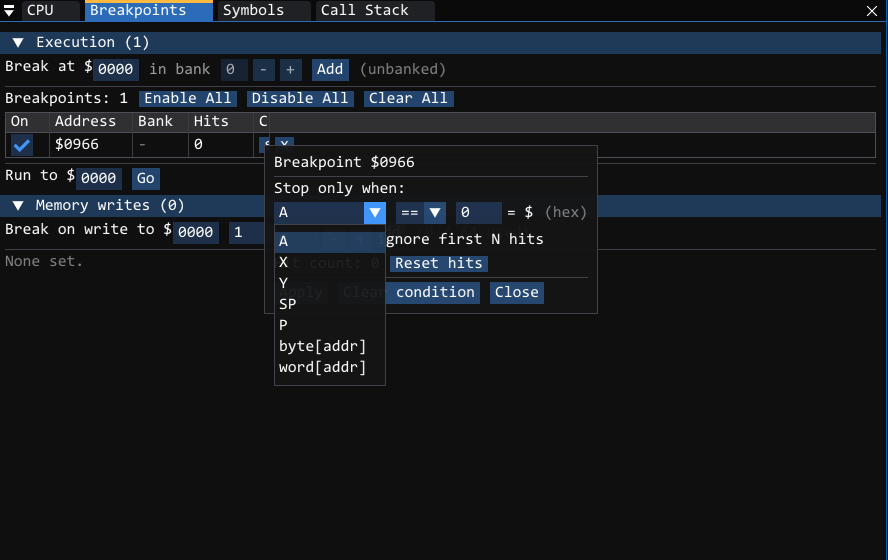
The left operand is a register (A, X, Y, SP, P) or memory (byte[addr], word[addr]);
the comparison and the value complete it. The value box is hex — it is labelled with a $ —
so $0A is decimal ten:
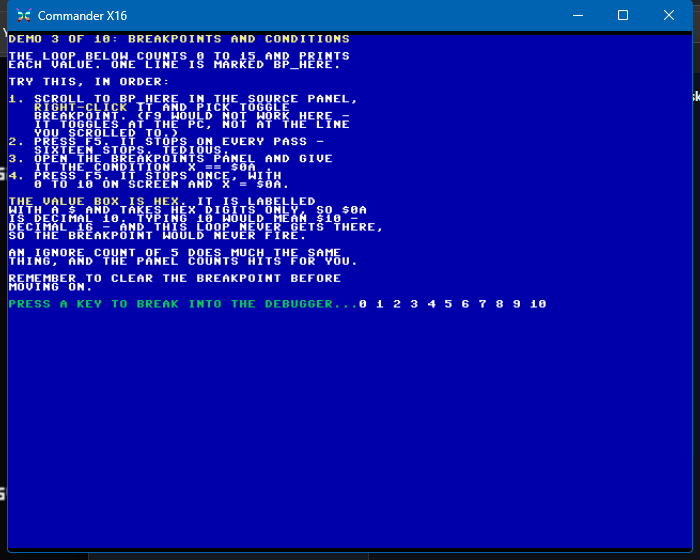
Run, and the loop stops on exactly the pass you asked for — the eleventh, with the emulator having
printed 0 through 10 and X still reading $0A because the INX has not happened yet:
The panel lists every breakpoint with its bank, hit count and condition, and has both a Memory writes section for watchpoints and a Run to box:
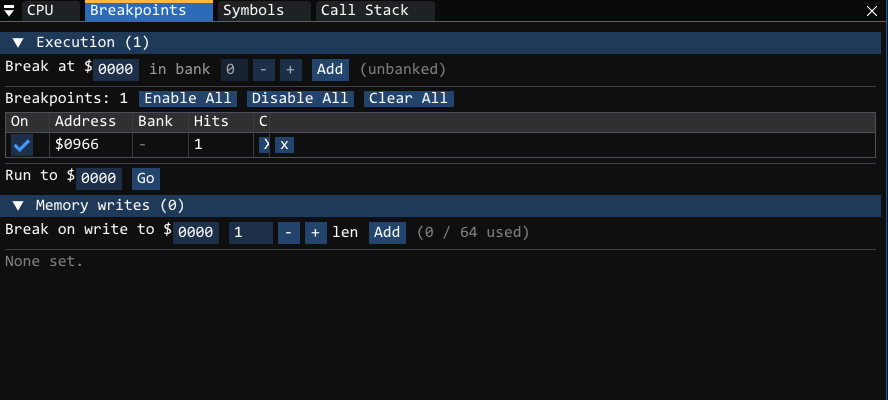
Conditions and hit counts set from a DAP client appear here too, and vice versa; the DAP syntax is documented under Remote debugging with DAP.
Catching early boot with -bp
Every other way of setting a breakpoint needs the machine to already be up and you to already be
looking at it. -bp is the one that does not: it arms the breakpoint before the first
instruction runs, which is the only way to stop inside something that has already finished by
the time you could click a gutter — a .prg that runs from its load address, KERNAL or ROM code
during start-up, or anything reached from the reset vector.
The usual pairing is with the graphical debugger, so the machine is already stopped at the interesting place when the window appears:
x16emu -imgui -prg myprog.prg -run -bp C000
It composes the same way with the other front ends, and can be repeated:
x16emu -imgui -bp C000 -bp 05:A000        # several, one pinned to RAM bank 5
x16emu -debugport -bp C000                # stop at boot, attach an editor afterwards
x16emu -bp C000                           # no front end named, so -debug opens
A breakpoint is no use without something able to resume from it, so -bp opens the text
debugger when you have not asked for another front end. Name -imgui or -debugport and it
leaves your choice alone. -wp <address>[,<length>] works the same way for writes.
The breakpoint belongs to the command line, not to whichever debugger displays it. It shows up
in the Breakpoints panel and to a DAP client, and neither can take it away — a client
disconnecting leaves it exactly where you put it. Deleting it is a deliberate act: F9 on the
line, or the bin in the Breakpoints panel.
Watchpoints — break on write
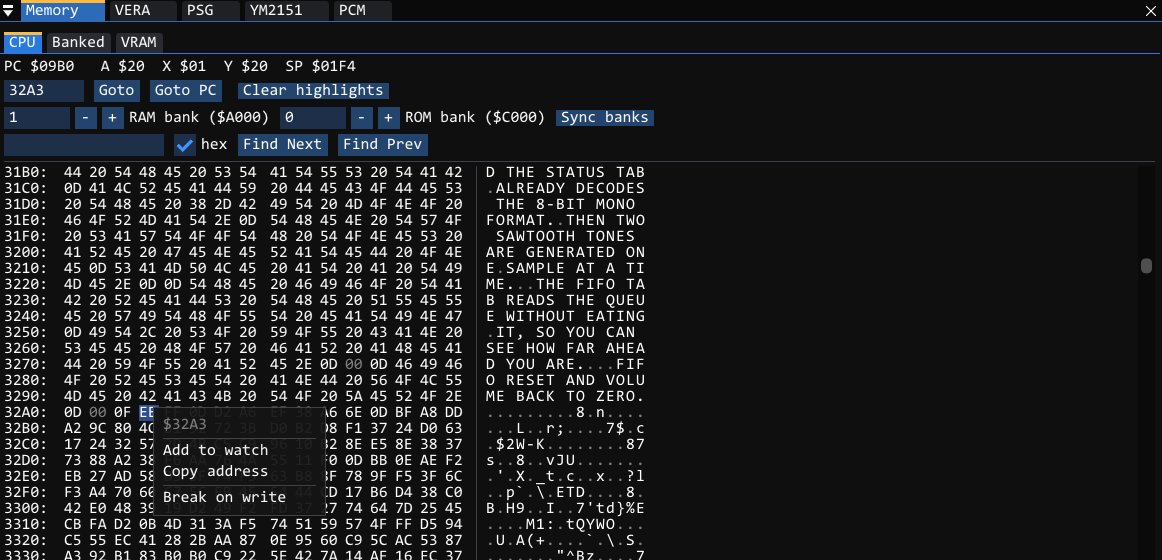
A breakpoint stops when the PC reaches an address. A watchpoint stops when the program writes to memory, which is how you find what is corrupting a variable when you have no idea which code is to blame. Right-click any byte in the Memory panel — or drag-select a range first, for up to 64 active watchpoints:
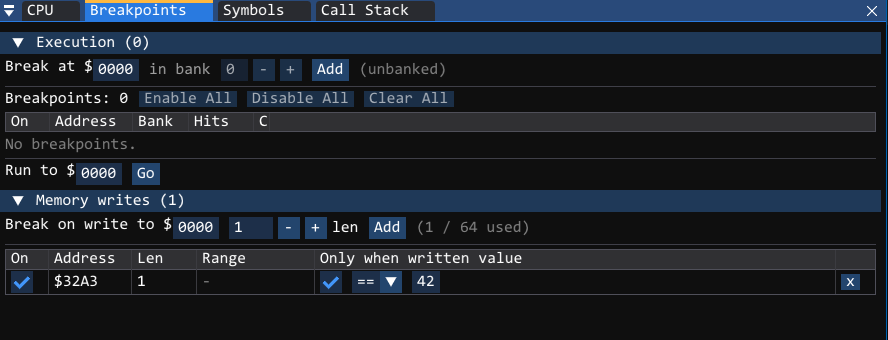
Each watchpoint can carry a value filter, so you stop only when a particular value is written rather than on every store:
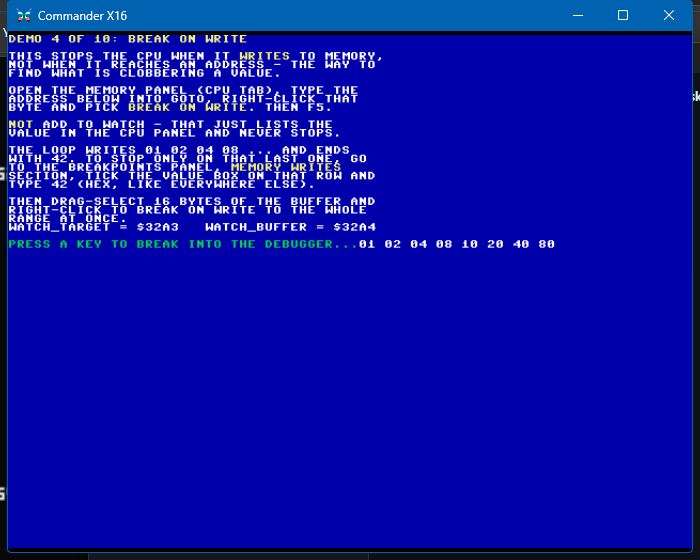
Run, and the eight earlier writes (01 02 04 08 10 20 40 80) pass straight through:
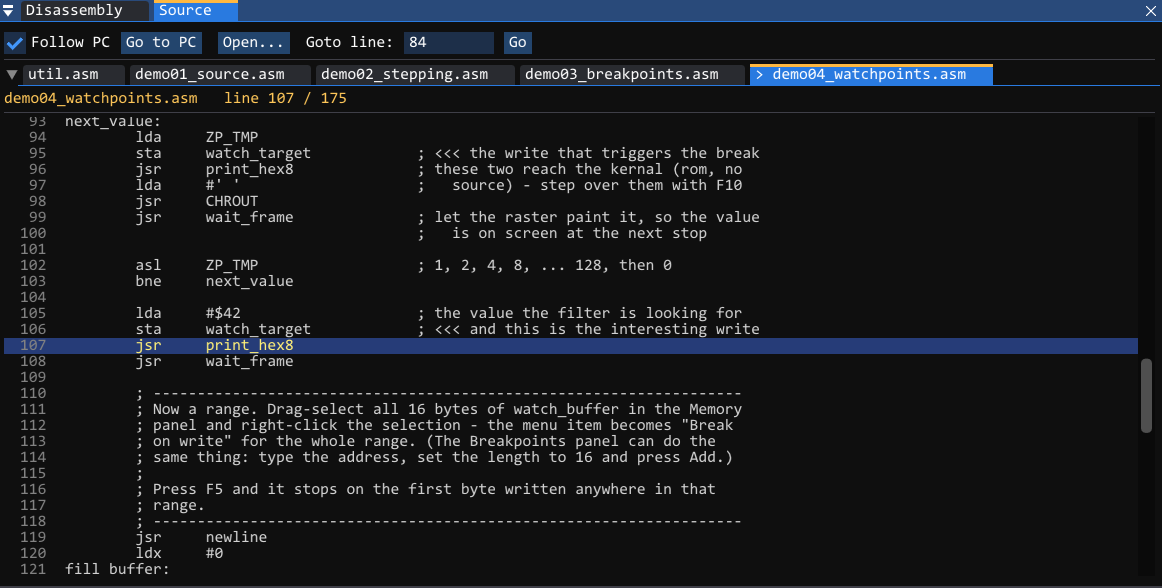
Execution stops on the instruction after the store that actually mattered:
A note on names. The debugger deliberately avoids the word watchpoint in the UI, because the CPU panel's Watch list already means something else — addresses you are keeping an eye on, which never stop execution. In the UI it is Break on write in the Memory panel's right-click menu and Memory writes in the Breakpoints panel.
VERA graphics debugging
The VERA panel has six tabs. All of them read the chip directly rather than the finished frame, so they are live and correct even while the machine is stopped and the emulator window is showing a stale image — and crucially, each view decodes using the registers that actually rendered each scanline, so raster splits show up as raster splits instead of being flattened to whatever the registers happened to hold at end of frame.
Registers
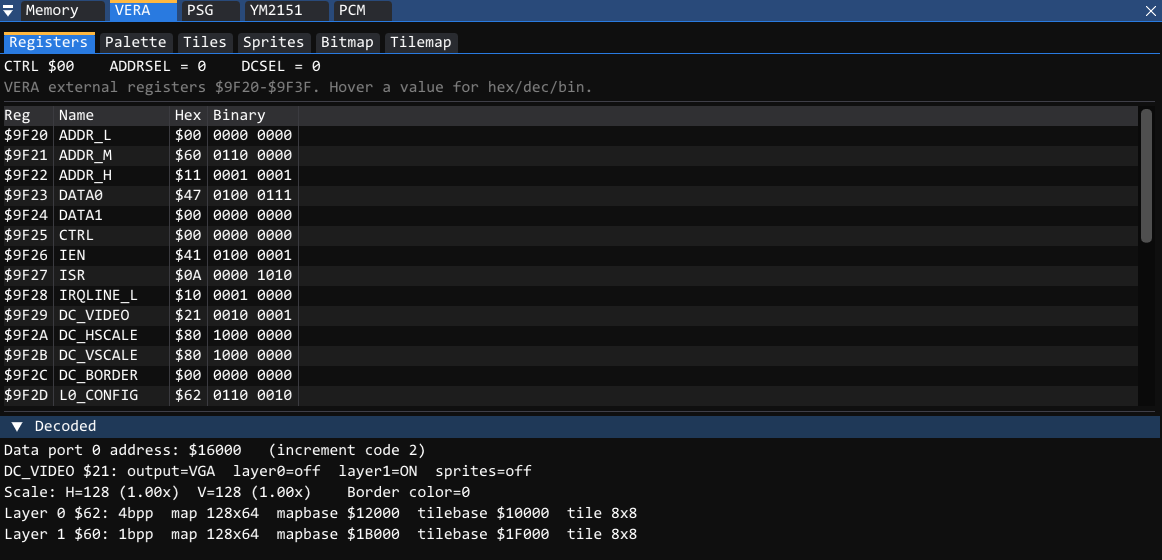
All 32 registers at $9F20–$9F3F in hex and binary, plus a Decoded block that spells out
what they add up to: the data port address and increment, output mode, which layers and sprites are
on, scaling, border colour, and each layer's depth, map size, map base, tile base and tile size.
Palette
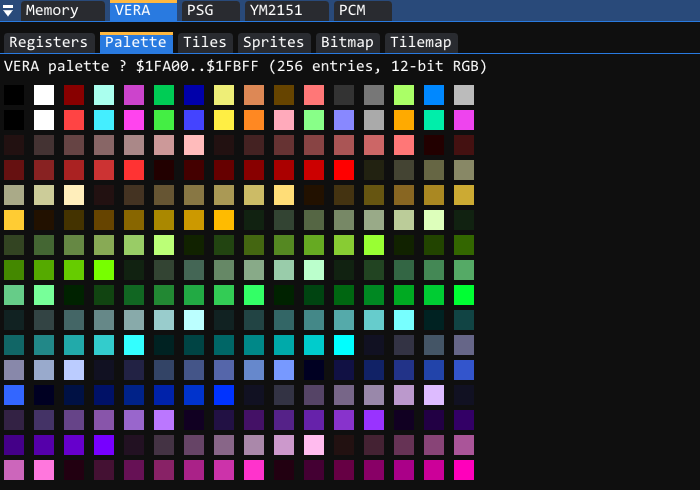
All 256 entries from $1FA00–$1FBFF as swatches. Hover one for its index and 12-bit RGB value.
Tiles
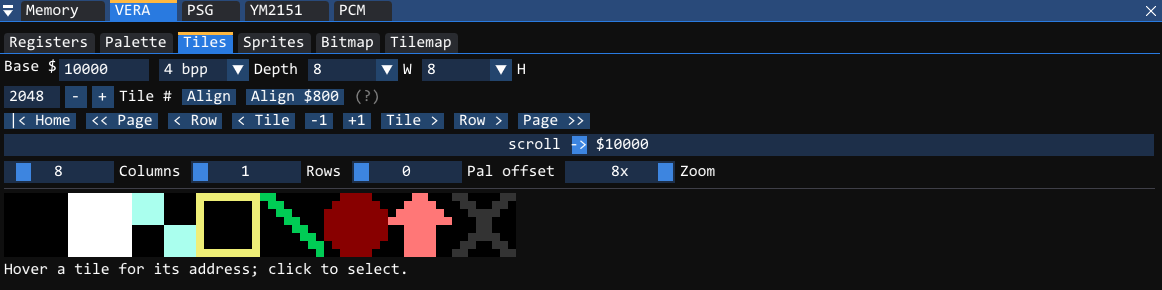
Decodes VRAM as tiles at whatever base address, depth, size, palette offset and zoom you point it at, so you can confirm your art landed correctly before anything is drawn with it. Hover a tile for its address; click to select.
Tilemap
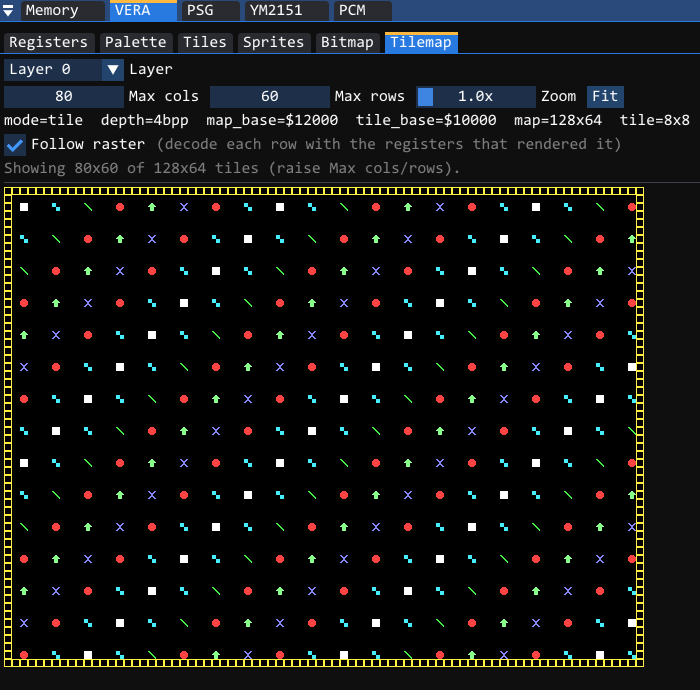
Renders a layer's map through that layer's own registers — the same tile base, map base, map size and depth the hardware is using. Follow raster decodes each row with the registers that were in force when that row was drawn, which is what makes mid-screen register changes visible.
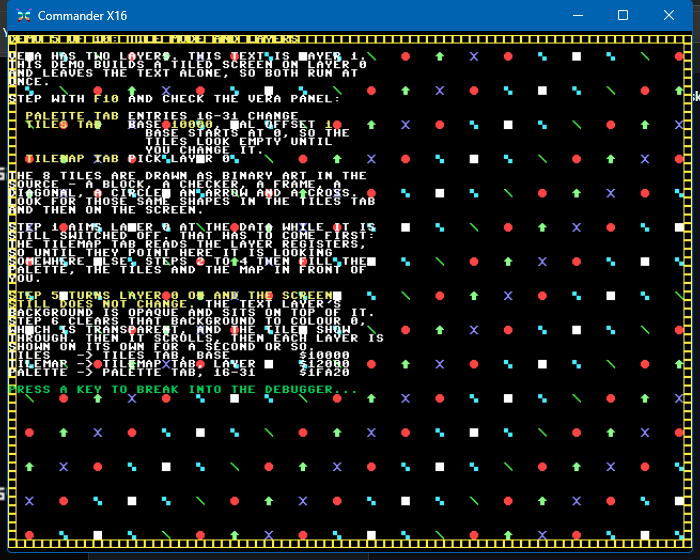
Here is the same map on the emulated display a moment later, once layer 0 was switched on and the text layer's opaque background was cleared:
Sprites
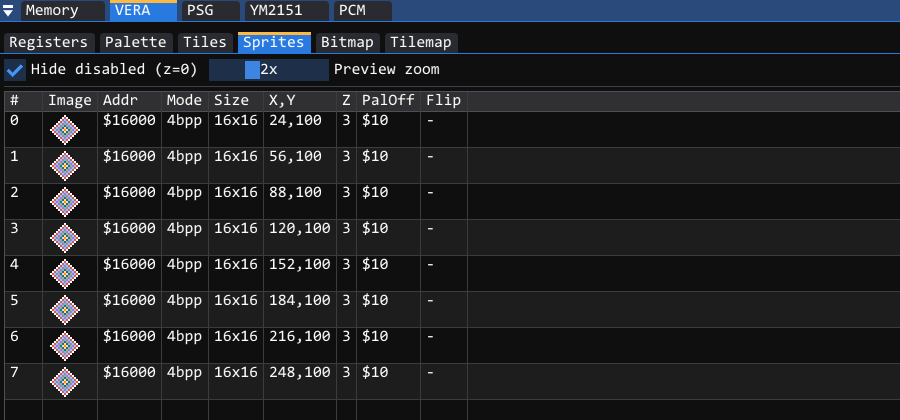
All 128 sprite records at $1FC00, fully decoded: a rendered preview of each sprite's image, its
data address, colour depth, size, X/Y position, Z-depth, palette offset and flip bits. Hide
disabled collapses the list to just the sprites that are actually live.
Bitmap
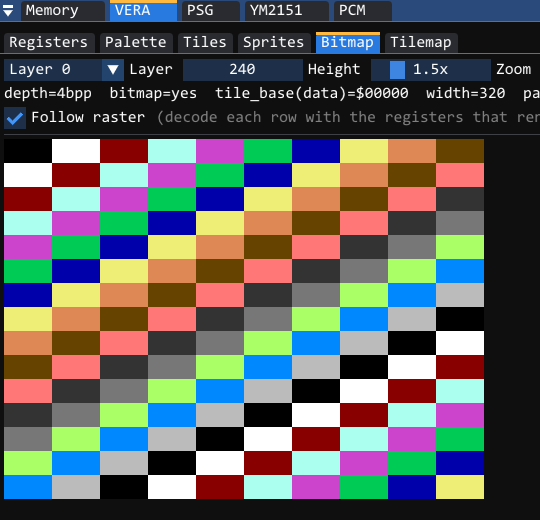
Decodes a bitmap-mode layer straight out of VRAM at the width, height and zoom you choose. Because it reads VRAM rather than the display, the image is visible while it is still being written and before the layer has been switched on at all.
Audio debugging
All three sound sources get a panel, and each shows raw register state, a decode of what that state means, and scope traces. While the machine is paused the panels keep drawing by projecting from the current register state, so you can see what a voice would be doing at the moment you stopped — the Hold audio panels while paused setting controls this.
PSG — VERA's 16-voice sound generator
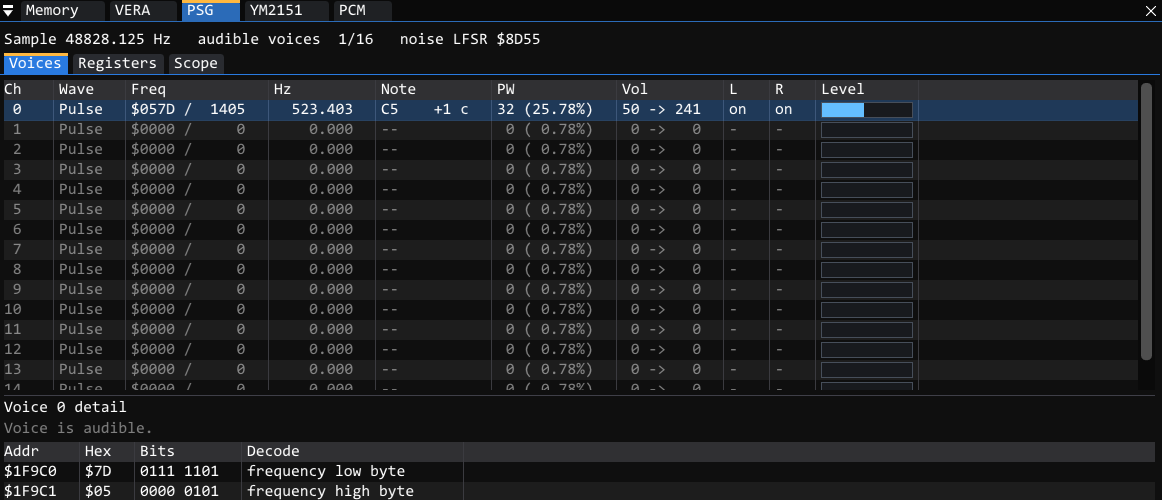
Every one of the 16 voices, with the raw frequency word decoded to Hz and to the nearest note with its cents error, the waveform, pulse width as a duty percentage, the volume both raw and after the hardware's lookup table, pan, and a live level meter. Selecting a voice expands the four registers behind it byte by byte. There are also Registers and Scope tabs, the latter with a trace per voice plus the summed output.
YM2151 — the FM chip
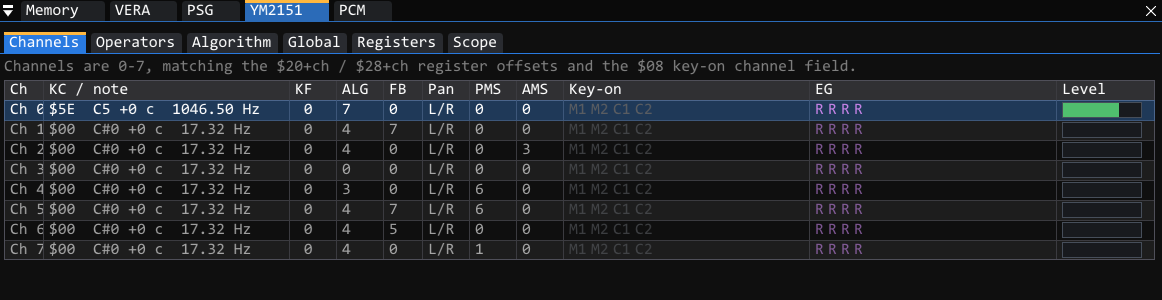
All eight channels with their key code decoded to a note and a frequency, algorithm, feedback, pan, PMS/AMS, per-operator key-on state, envelope phase and output level.
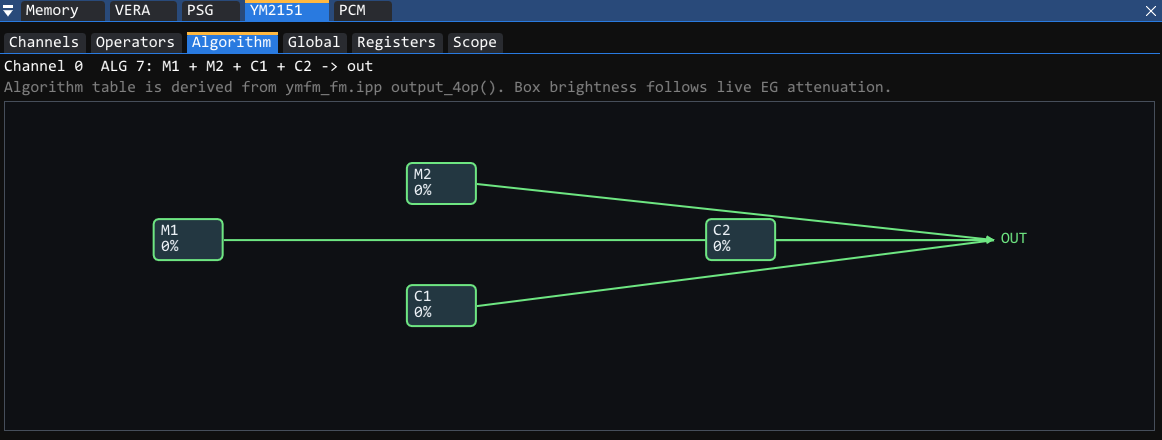
The Algorithm tab is the one worth knowing about: it draws the operator routing for the selected channel from the registers that were actually written, and box brightness follows live envelope attenuation, so you can watch a patch sound rather than reading its bytes.
PCM — the audio FIFO
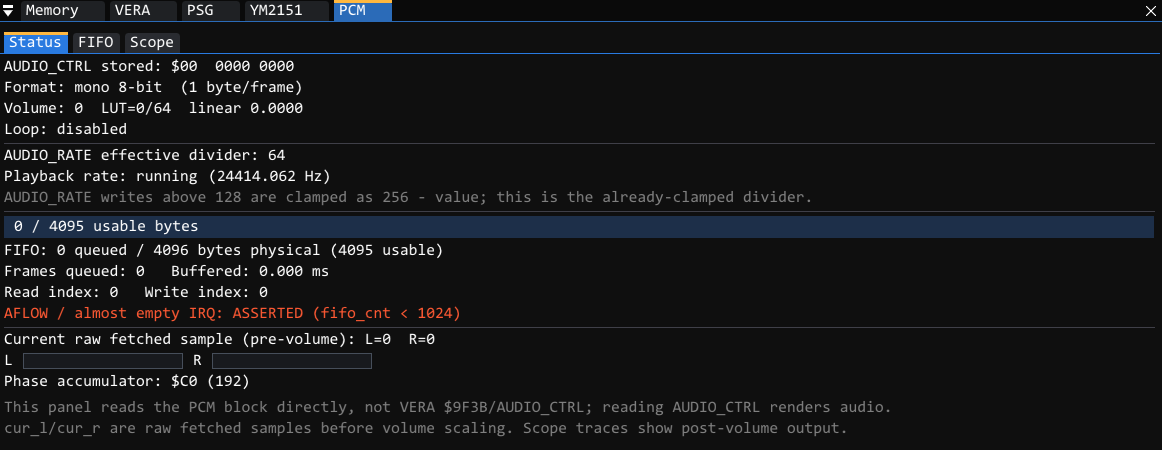
The audio FIFO is the one sound source where the CPU has to keep up, so this panel is mostly about
whether it is: FIFO fill level as a bar and a byte count, how many frames that is in milliseconds,
read and write indices, and whether the AFLOW interrupt is currently asserted. Format, volume and
playback rate are decoded from AUDIO_CTRL and AUDIO_RATE, and the panel reads the PCM block
directly rather than through $9F3B, so inspecting it does not itself consume audio.
Watching I/O and file access
The I/O panel covers the ports: everything in $9F00–$9FFF, plus the devices that hang off
them. Its Activity tab is a rolling log rather than a state dump, because I/O is a
conversation — a command goes out, a status comes back — and a snapshot taken between commands
tells you nothing. Each row names the register it touched (DATA0, T1C_L, SPI_CTRL) and
explains it on hover, so you are not looking up addresses in a manual while you debug.
Capture is off by default, and so is every device. It is the one debugger feature the running
machine pays for — a test and a branch on every I/O access — and the I/O page is the busiest
address range in the system. Turn it on, then tick only what you are actually looking for. Each
device's checkbox says what it captures, what it tells you that its own tab does not, and roughly
how fast it produces events: VERA's data ports alone are thousands of accesses per frame, and I2C
and the joysticks are polled around sixty times a second whether or not anything happens. The SD
card's data path at $9F3E/$9F3F is captured separately as SPI so it survives VERA being
off.
Every other tab works with capture off — they read live device state, not the log.
Two ways to reach a file, and only one of them has names
This is the thing worth knowing before you go looking for a filename and cannot find it.
| When | What you see | |
|---|---|---|
| Host filesystem | the default, no SD image attached | Real filenames. The emulator intercepts the KERNAL's IEEE calls, so it knows the name, the channel, the direction and the byte counts. |
| SD card image | -sdcard <image> | Blocks only. The ROM's own FAT driver runs inside the emulated machine and talks to the card over SPI. The emulator sees CMD17, an LBA and 512 bytes — never a name. |
They are mutually exclusive by default: -sdcard turns host-filesystem access off unless you also
pass -hostfsdev. -fsroot sets the host directory the machine sees — it does not attach a
card, so with -fsroot alone the SD tabs are legitimately empty and say so.
The Files tab shows both, in separate sub-tabs, so it is always clear which one is in play.
Its host-filesystem half keeps an always-on history of opens, closes, directory listings, DOS commands and the status each produced. That history is the point: a file operation erases itself when it completes, so a list of currently open channels is empty almost all the time, and a directory listing or a failed open would otherwise flash past unseen. The history is kept whether or not capture is on, because file operations are rare enough to record for free.
For the SD image, ADD closes the gap by parsing the filesystem itself: Build index reads the
image's partition table, BPB, FATs and directory tree — including long filenames — and maps every
cluster back to a path. Block traffic then resolves to /GAMES/FOO.PRG + 2048, and the file list
shows how many bytes of each file the machine has actually read or written this session, listing
the files it touched first so they stand out from the ones that merely exist.
The index is a snapshot, not a live view. If the machine writes to a FAT or a directory the index is marked STALE and you rebuild it by hand. That is deliberate: quietly serving a filename that has since become wrong would be worse than admitting the index has aged.
Performance budgets
The 6502 never idles. It burns every cycle of a frame whether your code is working or spinning on a vsync flag, so "cycles per frame" is always 100% and tells you nothing. The Performance panel answers the question you actually have — how much of the frame is my code using, and how much room is left? — by telling work apart from waiting.
Pick a target frame rate and it shows the split against that budget: a stacked bar of work, interrupt time and idle drawn to the width of the budget, so overrunning visibly runs off the end rather than quietly rescaling. Headroom is reported in cycles and scanlines, which is the unit most X16 code is written in. On an 8 MHz machine a VGA frame is exactly 134,400 cycles, or 256 per scanline.
Target FPS asks how many vsyncs your frame work may span. The frame period is fixed by VERA, so
asking for 30 fps does not make frames longer — it means the work may take two of them and the
budget doubles. A target faster than the machine scans is the opposite question ("must this fit in
half a frame?") and gets a fractional budget.
Below that: a per-frame history graph with the budget drawn across it and overruns in red; rolling
statistics over 1s / 10s / 30s / 60s / session with min, mean, p50, p95, p99, max and budget
overruns; and a breakdown attributing cycles to named routines. Zones can be drawn by address
— or picked straight off a symbol from your .dbg, since nobody knows the extent of
sprite_update by heart — and a zone can be flagged idle to declare "cycles here are waiting".
Waiting is found automatically: WAI, plus a store-free tight loop, which covers polling $9F27
and polling a flag an IRQ handler sets. It cannot see a wait loop that stores or calls a
subroutine — mark those as an idle zone, or bracket the real work with $9FBC markers from the
guest for exact attribution. docs/perf-budget.md documents the model and
its limits in full.
Everything here is also available over DAP — see Profiling the guest — so CI can watch for regressions without a human reading a panel.
The panel is open and docked with the other bottom-row views by default, so a normal -imgui
session profiles from boot — the numbers are only useful if they are already there when you go
looking. That costs the running machine an add and a table lookup per instruction; close the tab
and it stops.
Source-level debugging with cc65
Build with debug info, and the emulator will show you your own source instead of raw disassembly.
Build, in assembly:
ca65 --debug-info -o myprog.o myprog.s
ld65 -C myprog.cfg --dbgfile myprog.dbg -o myprog.prg myprog.o
Build, in C:
cl65 -t cx16 -g -Wl --dbgfile,myprog.dbg -o myprog.prg myprog.c
Run:
x16emu -imgui -prg myprog.prg -run -dbgfile myprog.dbg -srcpath ./src
There are two ways a .dbg gets loaded:
-dbgfile <file.dbg>loads one explicitly at start-up.- Whenever the machine loads a program from the host filesystem —
-prg, a BASICLOAD, or a DOS shortcut like/PROG.PRG— the.dbgsitting beside it is merged automatically. The rule is simply to swap the extension:myprog.prg→myprog.dbg. Debug info describing the address range being replaced is dropped first, so an overlay loading over another module takes over its addresses, and swapping the first one back restores it.
Runtime loading follows the debugger: it happens whenever the debugger is enabled. -no-dbgauto
turns it off, and -dbgauto forces it on without the debugger. It is worth turning off for
software you do not trust, because the file being read is chosen by the emulated program, and a
.dbg can name source paths anywhere on the host.
Two limits are worth knowing. Loads that do not use the KERNAL's block-transfer path are not
noticed — VERIFY, loading into VRAM, and loading into $9D00–$9FFF all fall back to
byte-at-a-time reads. And editing a .dbg while the emulator is running has no effect, because
each file is merged once; restart the emulator after a rebuild.
Because a .dbg only records source file names, the emulator locates the actual .s/.c files
by searching, in order: the path stored in the .dbg, the directory of the .dbg, each
-srcpath <dir> you passed (most recent first), the directory of the loaded program, and finally
the current directory.
C programs show the C. cc65 compiles myprog.c to myprog.s and assembles that, and
with -g the .dbg describes the same bytes twice: once against your C statements and once
against the generated assembly, instruction by instruction. The debugger prefers the C, so the
Source panel follows your .c file and breakpoints set on a .c line land at the start of that
statement. The generated .s is left out of the source panel's Open… list, since cl65
deletes it on the way out; a .s you wrote yourself is still offered, and so is one you kept.
The disassembly is unaffected — it still aligns on the real instruction boundaries.
Stepping runs a whole C statement per press. F10 steps over a call — printf(...) and
everything it does is one press — and F11 steps into one, landing on the first line of the
function. Both fall back to stepping one instruction at a time when the debug info has no C in
it, so assembly projects step exactly as they always did; the Source panel has a Step by
line toggle if you want the instruction-at-a-time behaviour for C too. The Disassembly panel
is unaffected either way.
What you do not get for C yet is data: locals, parameters and watch expressions still have to be read as raw memory, because nothing here decodes cc65's software stack or its type records. Globals work, as they are ordinary labels.
Banked code is partly handled. A .dbg does not record which RAM bank a $A000–$BFFF
segment belongs to. When the running machine loads a program, the emulator notes which RAM bank was
mapped as the first byte landed, and associates that bank with the segment — but only when the
load's start address and size identify exactly one segment. A file containing several segments, or
one whose size does not match a segment, leaves those segments bank-unknown. Nothing consumes that
association yet; it is recorded for the debugger front-ends still to come.
Remote debugging with DAP
-debugport [<port>] starts a Debug Adapter Protocol
server over TCP, on port 9009 by default, so an IDE such as VS Code or Visual Studio can
attach for source-level debugging. It speaks standard Content-Length-framed JSON, so any
compliant DAP client works.
x16emu -debugport -prg myprog.prg -run -dbgfile myprog.dbg -srcpath ./src
x16emu -debugport 4711 ...           # pick your own port
x16emu -debugport -imgui ...         # attach an IDE and watch the panels at the same time
The emulator runs immediately on launch; it does not auto-pause waiting for a client.
A minimal VS Code attach configuration looks like this — note that the type value depends on
which DAP extension you wire it up to, as no editor extension is bundled with the emulator:
{
  "version": "0.2.0",
  "configurations": [
    {
      "name": "Attach to X16 Emulator",
      "request": "attach",
      "type": "x16",
      "host": "localhost",
      "port": 9009
    }
  ]
}
What the server supports
Standard requests: initialize, launch, attach, configurationDone, threads, stackTrace,
scopes, variables, setVariable, setBreakpoints, setFunctionBreakpoints,
setInstructionBreakpoints, setDataBreakpoints, setExceptionBreakpoints, breakpointLocations,
continue, next, stepIn, stepOut, pause, goto, gotoTargets, stepInTargets,
evaluate, readMemory, writeMemory, disassemble, loadedSources, source, restart,
disconnect and terminate.
Custom requests: x16/registers, x16/sendKey, x16/type, x16/joystick, x16/perfStats and
x16/perfConfig. The server also emits a custom x16/perfBudgetOverrun event. Clients can detect
the profiling surface from the supportsX16PerfStats capability in the initialize response.
Four scopes are exposed on every stack frame: Registers (including the 65C816 extras and the current RAM/ROM bank), Virtual Registers (R0–R15), Zero Page and Stack. Memory reads and writes use 24-bit addresses, so the high byte selects the 65C816 program bank on a GS machine.
Reading and writing VRAM
VERA's video RAM is not in the CPU map — the CPU reaches it only through the data port, one
auto-incrementing byte at a time — so readMemory and writeMemory take a vram: prefix on
memoryReference to address VERA's 17-bit space directly:
readMemory  { "memoryReference": "vram:1B000", "count": 32 }
writeMemory { "memoryReference": "vram:1B000", "data": "3q2+7w==" }
VRAM addresses default to hex, with $ and 0x accepted too; a bare reference is still a CPU
address. The echoed address keeps the prefix, so paging through VRAM by feeding it back with an
offset stays in the right space. This is the only way to write VRAM over DAP, and unlike the
vram console expression it is not capped at 128 bytes and returns binary rather than text.
A reference that cannot be parsed is now rejected. It used to fall back to address 0, so a typo
answered success: true with the bytes from the wrong memory and nothing to say so.
Instruction breakpoints and banks
setInstructionBreakpoints takes an instructionReference in either form:
setInstructionBreakpoints { "breakpoints": [ { "instructionReference": "33:A555" } ] }
setInstructionBreakpoints { "breakpoints": [ { "instructionReference": "0x33A555" } ] }
bb:aaaa names a RAM/ROM window bank explicitly and means exactly what -bp bb:aaaa means, hex on
both sides. In the packed 24-bit form the high byte is read as the machine could have produced it:
the 65C816 program bank on a GS, and the window bank otherwise, since read6502 forces the program
bank to zero elsewhere. A bare 16-bit address names no bank and breaks in whichever one is mapped.
Naming a bank for an address the window registers do not reach — anything below $A000, or a
non-zero GS program bank — is refused with verified: false and a message, as is giving the bank
twice. Previously a banked reference was recorded against the program bank, which on a non-GS
machine is always zero, so the breakpoint matched nothing while the client had been told
verified: true. An offset displaces the address within its bank and no longer carries into it.
Conditional breakpoints
Put a condition string on a breakpoint in setBreakpoints. Terms are joined with &&.
- Pin to a bank:
bank == 2,bank 2,rombank == 3. Decimal or$XX/0xXX. - Test a value: operands
A,X,Y,SP,P,byte[$ADDR],word[$ADDR], or a bare$ADDR(which meansbyte[$ADDR]). Operators==,!=,<,<=,>,>=.
A == $05
byte[$1234] != 0
word[$0002] >= $0100
bank == 0 && byte[$1234] != 0
A hitCondition of "5" stops on the fifth hit.
Expressions you can evaluate
These work in a watch or REPL window, in addition to plain registers and addresses:
| Expression | Result |
|---|---|
$C000, $01C000, 0xC000 | The byte at that CPU address (24-bit; high byte is the 65C816 bank) |
A, X, Y, SP, PC, P | Register values, sized for the current CPU mode |
regs_all | A one-line summary of every register |
vram ADDR [COUNT] | VERA VRAM bytes, from a 17-bit hex address (capped at 128; for bulk or binary access use readMemory with a vram: reference) |
vera_reg | All 32 VERA registers |
vera_line LINE | The layer registers that actually rendered that display scanline — the way to catch a raster split |
bp_add ADDR, bp_remove ADDR, bp_list, bp_clear | Manage breakpoints |
watch_add ADDR [LEN], watch_remove ADDR, watch_list, watch_clear | Manage write watchpoints |
reset | Reset the machine |
cc65 labels and equates from a loaded .dbg resolve too.
Scripting input for automated tests
Three custom requests let a script drive the machine, which is what makes automated regression runs of a game practical:
| Command | Arguments | Effect |
|---|---|---|
x16/sendKey | key (SDL key name like "Return"/"A"/"Left", or a numeric scancode), action ("press" (default), "down", "up"), optional modifiers (array of key names held around the key) | Injects a key event through the same path as a physical key press. |
x16/type | text (string) | Types a string into the KERNAL keyboard buffer, like a clipboard paste. Ideal for BASIC lines and filenames; supports the \Xnn hex escape. |
x16/joystick | index (port 0–3), buttons (array of up, down, left, right, a, b, x, y, start, select, l, r), optional mask (raw 16-bit active-low), enabled (false releases the port back to a physical controller; true on its own connects one with nothing held) | Holds or releases a virtual SNES controller. Buttons not listed are released, so one request sets the whole held state. |
x16/joystick needs no gamepad and no -joy1..-joy4 flag: driving a port enables it, so a
headless CI machine can play a game that reads the controller. Sending neither buttons nor
mask reports the port's state without changing it, which is how a test asserts what it just
pressed. Every request answers with the resulting mask, the held buttons, and whether a
physical controller is bound.
While a port is held its shift register behaves as an attached controller's does, so the KERNAL
reports a joystick present — JOY(1) reads $00 with nothing held rather than $FF. Releasing
it with enabled: false makes the port read empty again.
There is also x16/registers, which returns the full CPU, KERNAL and VERA state as JSON in one call.
Profiling the guest: how much of a frame is your code using?
The 6502 never idles — it burns every cycle of a frame whether your code is working or spinning on a vsync flag — so "cycles per frame" is always 100% and tells you nothing. The emulator therefore classifies cycles as work or waiting, and reports the work against a frame budget. It measures VERA's VRAM bandwidth alongside, because a program can have cycles to spare and still run out of bus. See docs/perf-budget.md for how the classification works, what the bandwidth model is derived from, and where each can be fooled.
| Command | Arguments | Effect |
|---|---|---|
x16/perfStats | optional windows (array of seconds, or names like "30s"/"session"), includeZones (default true), includeFrames (raw per-frame samples, oldest first) | Returns the budget, the last completed frame, rolling statistics — min/mean/p50/p95/p99/max, budget overruns and the worst one — per window, and a bandwidth object with VERA's VRAM traffic. Asking arms both if they were off. |
x16/perfConfig | enabled, targetFps, idleMode ("auto"/"markers"/"none"), historyFrames, overrunEvents, zones (array of {name, start, end, bank, idle}), reset | Configures the above. zones replaces the address zones wholesale. |
The bandwidth object answers the other half of "what is eating my frame?": what VERA's VRAM
bus did, rather than what the CPU did. It reports per-layer fetches and bytes, the CPU's own
traffic through $9F23/$9F24 — the one piece of VERA bandwidth a program controls directly —
and VERA FX amplification, where one sta can move four bytes.
Its headline is peakLineClocks against lineClocks (800), not a percentage of VERA's total
bandwidth: a frame uses maybe a fifth of the chip's 100 MB/s, so percent-of-peak would be true and
useless. One scanline is the window that genuinely runs out. Sprites are last on that bus, so
spriteBusHeadroomClocksAtPeak is what the sprite renderer was really competing for.
Every clock figure in bandwidth is bus occupancy, and clockUnits says so. That is a
different clock from the one the sprite views report: sprite render time is wall clock and runs
about five times higher, because it ticks while the renderer paints with the bus idle. Convert
before comparing the two — sprite render time has its own view in the VERA panel under
Multiplex → Render time.
The emulator also pushes an x16/perfBudgetOverrun event when the guest misses its budget,
coalesced to at most one per second with a count and the worst frame in that period — so tooling
can spot a regression without polling.
targetFps asks how many vsyncs your frame work may span. The frame period is fixed by VERA, so
asking for 30 fps does not make frames longer: it means the work may take two of them, and the
budget doubles. A target faster than the machine scans is the opposite question — "must this
routine fit in half a frame?" — and gets a fractional budget. On an 8 MHz machine a VGA frame is
exactly 134,400 cycles, or 256 per scanline.
Profiling costs the running machine an add and a table lookup per instruction. The Performance
panel is open by default, so -imgui profiles from boot and closing the tab stops it; without the
panel, nothing is collected until a DAP client asks.
The control port: the same numbers to a test harness
-controlport <port> serves the Retro Remote Debug Controller
HTTP contract on 127.0.0.1:<port>: the surface a pytest harness drives to read memory, step
frames deterministically, take screenshots and inject keys, pads and the pointer. It is the plain
fork's control port with one more level, contract 0.6, which adds the profiler:
| Request | Effect |
|---|---|
GET /perf?windows=1,30,session&frames=n&since=f | The budget, the last completed frame (total, work, idle, IRQ, main), the statistics windows, the zones with their own windows, raw per-frame records (since= the last frame you saw, so none is missed), and platform: VERA's bandwidth (with lines=1, each scanline's clocks) and the sprite renderer's time per line (sprites). |
POST /perf | A JSON body: enabled, targetFps, idleMode, historyFrames, reset, zones (address ranges, or {"name", "marker"} to name a guest's $9FBC region), and sprites (sprite render timing, off until asked). |
The fields are x16/perfStats's, from the same builders, so a number means the same thing
whichever way a client asked. /perf needs cJSON, as DAP does; without it the port serves 0.5.
SDL_VIDEODRIVER=dummy SDL_AUDIODRIVER=dummy ./x16emu -prg GAME.PRG -run -controlport 8391 &
curl -s -XPOST localhost:8391/perf -d '{"enabled":true,"zones":[{"name":"logic","marker":1}]}'
curl -s 'localhost:8391/perf?windows=1,session&frames=60'
Run it with a display driver, dummy or real, not -headless: the port's /step counts video
frames, which a headless run never completes.
x16dbg, the bundled command-line client
tools/x16dbg is a small .NET 8 console DAP client, useful for poking at a running emulator
without an IDE and for scripting.
dotnet run --project tools/x16dbg                       # interactive
dotnet run --project tools/x16dbg -- mem 1030-1040      # one-shot
dotnet run --project tools/x16dbg -- -host 127.0.0.1 -port 9009
Options are -host <ip> (default 127.0.0.1), -port <port> (default 9009), -i to force
interactive mode, and -h for help. With no command it drops into an interactive prompt.
Commands, in both modes: step/s, continue/c, break/b, status/t, reset,
regs/r, setreg <reg> <hexval>, mem <addr>-<end> or mem <addr> <len>,
setmem <addr> <hexdata>, vram/v and setvram for VERA's video RAM, joy/j to drive a
controller port, and bp add|remove|list|clear <addr>. Addresses are hex.
> b
! STOPPED (pause)
  PC=$C1C6  A=$02 (  2)  X=$FF (255)  Y=$0A ( 10)
  SP=$F0  P=$24 [--B-DI--]  RAM Bank=$00  ROM Bank=$00
> bp add 080D
> mem C000-C00F
  C000: A9 00 85 00 A9 01 85 01 A9 00 8D 00 02 A9 00 8D  |................|
> c
vram reads VERA's 17-bit video RAM, which is not in the CPU map — so mem 1B000 and
vram 1B000 are two different memories at the same number — and setvram is the only way to
write it. Both echo the bytes back after a write:
> vram 1B000 10
  1B000: DF 64 20 64 20 64 20 64 20 64 20 64 E9 64 20 61  |.d d d d d d.d a|
> setvram 1F9C0 CAFEBABE
Wrote 4 bytes to vram:1F9C0
  1F9C0: CA FE BA BE                                      |....            |
joy <port 1-4> drives a virtual SNES controller with no gamepad attached and no -joy1..-joy4
flag. The button list is the complete held state, so anything left off it is released:
> joy 1 right a
  Joystick 1: right a
    mask=$FF7E  source=virtual
> joy 1 start          (right and a let go)
> joy 1                (query, changes nothing)
> joy 1 none           (connected, nothing held — JOY(1) reads $00)
> joy 1 release        (port empty again — JOY(1) reads $FF)
Buttons are up down left right a b x y start select l r.
One caveat about one-shot mode: each command is its own debug session, and the emulator resumes
when a session that paused it goes away — deliberately, so a headless machine cannot be left
halted with nobody able to restart it. Commands that only inspect are fine, and memory, VRAM and
joystick state persist either way, but anything that depends on staying stopped (break,
setreg, stepping) belongs in interactive mode, where one session stays open.
Web Site
Commander X16: https://commanderx16.com
X16Emu ADD: https://github.com/xylothan/x16-emulator
License
Copyright (c) 2019-2023 Michael Steil <[email protected]>, www.pagetable.com, et al. All rights reserved. License: 2-clause BSD
ADD's additions are released under the same 2-clause BSD license. Dear ImGui is vendored in
src/extern/imgui/ under its own MIT license.
Release Notes
See RELEASES.md for what each ADD build adds. The release notes for the upstream emulator each build is based on are published upstream.